So here’s a thing that started as “I’ll just grab some weather data and display it” and turned into a proper little project with caching, containerisation, and a surprisingly interesting detour into numerical weather models.
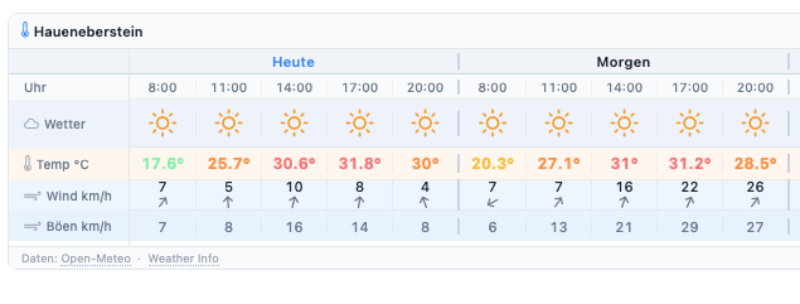
The result is a small embeddable weather widget that you can see on the Modellfluggruppe Haueneberstein website. It shows the next three days of weather for a flying field, with time slots from 08:00 to 20:00, updated once per hour. Wind speed, wind gusts, temperature, and a weather icon for a quick visual read. With mouse-over, you’ll see additional data such as CAPE and Strength to indicate the intensity.
It’s running at weather.node01.de — if you run an RC flying field and want your site to show the same widget, get in touch. More on that at the end.
Where does the data come from?
All data comes from Open-Meteo, a free and open weather API. No API key required, no account, no rate limit drama — just a clean HTTP call and you get back a JSON blob with everything you need. Genuinely one of the nicest APIs I’ve worked with.
But the interesting part is which weather model powers the data.
Why ICON-D2?
Open-Meteo lets you pick the underlying numerical weather model. The default “auto” mode blends several models depending on what’s available for your coordinates. That’s fine for general use. For RC flying in Germany, though, I wanted something more specific.
The model I settled on is ICON-D2, operated by the Deutscher Wetterdienst — the German Weather Service. Here’s why it’s the right choice:
- 2 km grid resolution. Most global models work at 10–25 km resolution, meaning one data point covers an area the size of a small town. ICON-D2 resolves down to 2 km, which makes a real difference in terrain with varying topography — think valleys, ridgelines, the edge of a forest. Haueneberstein sits in the Vorbergzone of the Black Forest, where local wind effects are a genuine thing.
- Updated every 3 hours. Fresher data than most alternatives.
- Coverage. ICON-D2 covers Germany, Austria, and Switzerland — exactly where most of the flying fields I care about are.
The global ECMWF model has better long-range accuracy, but for a same-day 3-hour-window forecast at a specific field, DWD’s local model wins.
What does the widget actually show?
Each time slot (08:00, 11:00, 14:00, 17:00, 20:00) shows:
- A weather icon — sunny, partly cloudy, rain, or storm, derived from cloud cover and precipitation
- Temperature in °C, colour-coded from blue (cold) to red (hot)
- Wind speed at 80m altitude in km/h — that’s the flying layer, not the ground
- Wind gusts at 10m — because what happens at ground level during takeoff and landing is what bites you
The gusts are colour-coded too: grey below 30 km/h, orange from 30, red from 50. If you see red gusts in the morning slot, maybe sleep in.
Two more values are tucked away as a tooltip on the weather icon: shortwave radiation (W/m²) and CAPE (Convective Available Potential Energy, J/kg). Hover over the icon to see them. Radiation is useful for estimating thermal activity — the higher it is, the more the ground heats up, the stronger the thermals. CAPE is the thunderstorm indicator: below 100 J/kg everything is fine, above 500 things get interesting, above 800 the icon switches to a thunderstorm and you probably want to pack up. These two didn’t earn their own row in the widget — they’re context rather than primary flying conditions — but they’re there for anyone who wants them.
The technical bit
If you don’t care about Python and caching, skip this. No hard feelings.
The backend is a small Flask application running behind Gunicorn with two workers. Flask handles the routing — one endpoint serves the widget HTML, another returns the weather data as JSON. The widget itself is a plain HTML page designed to be embedded as an iframe.
The interesting part is caching. Open-Meteo is free and polite, but there’s no reason to hammer it on every page load. The widget is embedded on a club website that might get dozens of hits on a sunny Sunday morning, all asking for the same data.
Enter Memcached. Every time the app fetches data from Open-Meteo, it stores the result in Memcached under a key derived from the coordinates — something like ww:48.8192:8.2185. That key has a TTL (time-to-live) of 3600 seconds — one hour.
The flow looks like this:
- Request comes in for a location
- App checks Memcached for the key
- Cache hit → return the stored data immediately, no external call
- Cache miss (key expired or never set) → fetch from Open-Meteo, store result in Memcached with a fresh 1-hour TTL, return data
This means Open-Meteo gets called at most once per hour per location, regardless of how many visitors load the widget. The “Stand” timestamp shown in the widget header reflects when the data was actually fetched — not when you loaded the page. If it says 14:23, that’s when the last real weather fetch happened. Your reload at 14:47 got the same data from cache.
Want this for your flying field?
The widget supports multiple locations, each configured with a name, latitude, and longitude. Adding a new field is literally three lines of YAML. If you run an RC flying field in Germany (or Austria or Switzerland, ICON-D2 covers those too) and want a weather widget on your club website, drop me a message. I’m happy to add the coordinates.
The embed is a single iframe tag:
<iframe
  src="https://weather.node01.de/widget?name=yourfield"
  width="800"
  height="204"
  style="border:none; border-radius:8px; max-width:100%;"
  loading="lazy">
</iframe>
That’s it. No JavaScript dependencies on your side, no tracking, no ads. Just weather data from the DWD, cached sensibly, displayed cleanly.