EdgeTX Log Analyzer - Flight Log Analyzer for RC Models and Drones
I developed a tool to analyze flight data from my RC gliders and drones. My main motivation was to create an easy‑to‑use solution that allows me to quickly review recent flights.
For example, I wanted to understand whether the reception quality of the two diversity antennas on my receiver differs, whether the antenna placement needs improvement, how high my throttle position was during flight, how much throttle was required to achieve a certain climb rate, how fast the RX battery voltage dropped, and much more.
This tool is a browser‑based application that uses JavaScript and the D3.js library to visualize flight data. To use it, simply select your CSV log file. The file is processed entirely within your web browser and the data is displayed as interactive graphs. You can choose which data sources you want to analyze from the available log fields.
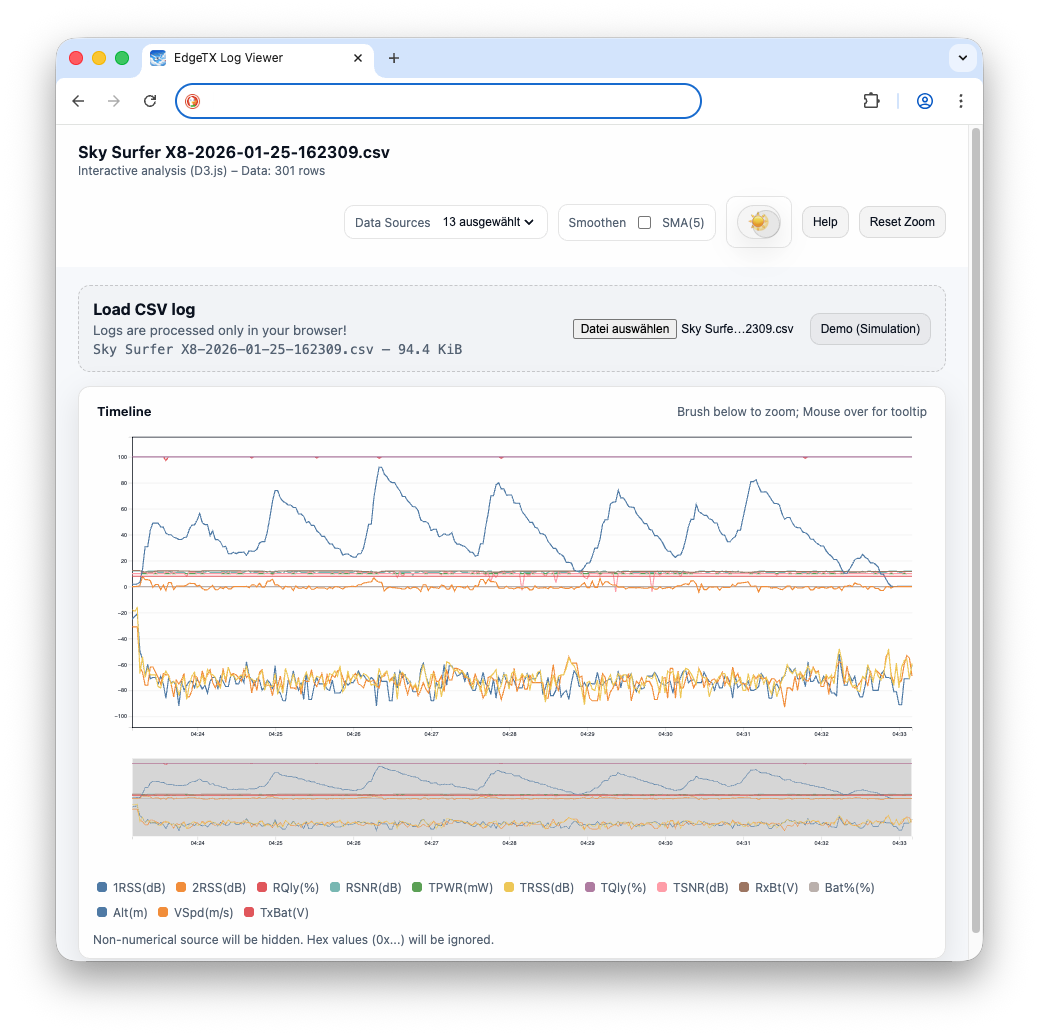
Figure 1: EdgeTX Log Analyzer in action
Installation and Usage
This web application can be used in several ways:
Online usage You can always visit https://analyzer.node01.de and analyze your log files directly in your browser. Since all calculations and visualizations are performed locally in your browser, no flight data is uploaded to the server.
Install as a Web App (PWA) The application can be installed as a web app in Edge, Chrome, and Safari. Simply click the install icon in the browser’s address bar. Once installed, the application can be used locally without requiring any further network connection.
Run locally from source You can also download the archive from my source code repository at vcs.node01.de
After downloading, open the file `public/index.html` in your web browser to analyze your log files locally.
Contribution and Feedback
Feedback and Contributions are welcome. You can reach me at soaring@pkgbox.de or checkout my code repository at vcs.node01.de
Privacy
If you have any questions regarding data protection and privacy, please refer to the privacy policy available at: GDPR node01.de.